Ch.8 Perfect Competition

3a.) A firm in perfect competition is producing at the profit-maximizing output, but making a loss. Using diagrammatic analysis, explain how this is possible. 

Perfectly competitive markets are so easy to enter and exit that economic profit or losses acs as a powerful incentive to attract new firms or repel existing ones. For example, when a firm in a particular industry is earning profits, other firms can easily enter the market to enjoy the profits in that market. On the other hand, when a firm is facing loses, the other firms chooses to reduce their output or exit the market without any barriers.

A chocolate chip cookie industry is close to a perfectly competitive market. Lets say there are 250 firms that individually produces 100 set of cookies per week. By multiplying the quantity of cookies produced by the individual firms (250X100), there would be 25,000 cookies produced in one week.

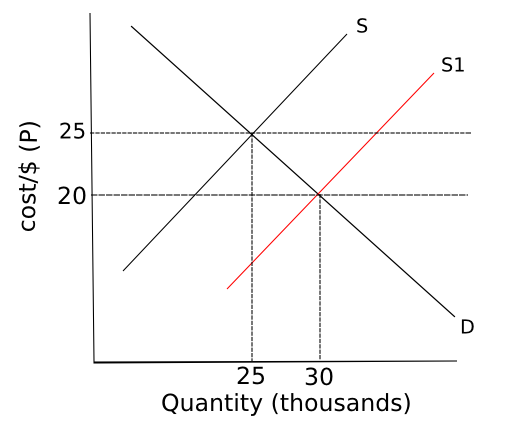
entry of new firms

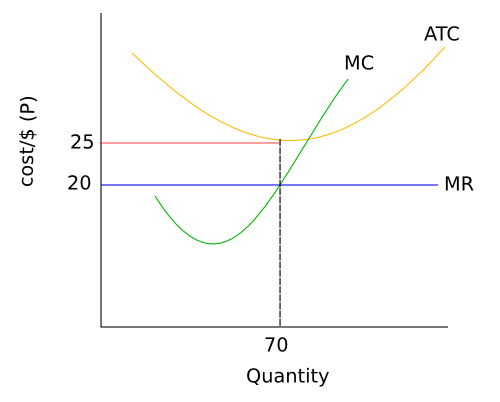
Ceteris paribus, a producer can earn $5 per thousand cookies produced with the market price of $25 in profit-maximizing output of 25,000 cookies. As new firms enter the market, the supply curve shifts to the right, causing the price to fall to $20 and quantity increases to 30,000 cookies. As a result the total output of cookies increase, and the price decreases. Increased competition gives the firms a smaller share of the total market, decreasing each individual output into 70 sets. When the marginal revenue (MR) is lower than the average total cost (ATC), the firm is experiencing a loss.

Screen Shot 2013-01-06 at 4.52.01 PM

3b.) Discuss the claim that all costs are identical among different firms in a perfectly competitive market. If this claim is correct, then why do some firms shut down before others when earning economic losses?

The claim that all costs are identical among different firms in a perfectly competitive market is correct, since the price taking firms produce completely identical products. The goods are not differentiated and act as perfect substitutes for each other. Therefore, every firm in a perfectly competitive market are producing indistinguishable goods thus the cost for each good is the same.

However, some firms shut down before others when earning economic losses. In order to determine if a firm should consider shutting down, they compare their total loss with the total fixed cost. If total loss exceeds total fixed cost, the firm can reduce the amount of loss by shutting down.

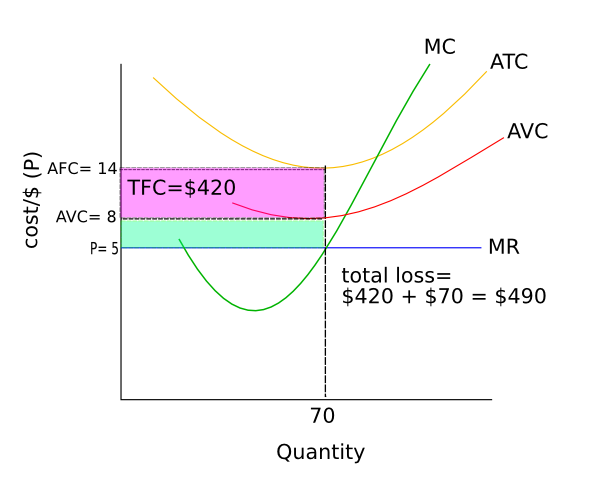
A typical shut down scenario can be illustrated by a cookie firm’s ATC and average variable cost (AVC) exceeding the price (diagram below). Recall that the AVC include the wages for workers, and costs of other variable inputs such as raw materials (in this case, ingredients for cookies).

Screen Shot 2013-01-06 at 5.38.05 PMThe total fixed cost (TFC) was $420, and the total loss of $490. As a result, the total loss was greater than TFC, thus the firm would shut down before others.


Ch.7 Costs, Revenues and Profit

1a.) Explain the relationship in the short run between the marginal costs of a firm and its average total costs.

When a business popularity grow, firms wishes to maximize the productivity of its resources in order to minimize its cost. Productivity is defined as the amount of output attributable to a unit of input. In order to increase productivity in a short run, we need to vary the quantity of labour we employ in producing a good instead of the quantity of capital or land. Furthermore, instead of opening a second shop, we hire more workers in the first shop and increase production to meet the demand.

For example, Krispy Kreme had one shop with one oven and two fryers. The three machines would be the firm’s capital, and the shop is the land. In order to increase production in the short run, it can increase the number of labor such as employing more workers and donut ingredients, but cannot increase the number of capital and land. In this case, Krispy Kreme trains the new employees for several days to learn how to make the donuts, thus by the time he/she actually work at the shop, they are highly productive (he/she makes as many donuts as possible during his/her working hours), and Krispy Kreme has a low per-unit cost and high profit margin. As the number of employees increase, the total product (how many donuts produced per hour) changes, affecting the marginal (the change in the total product attributable to the last worker hired) and average product (output per worker).

An increase in the change between the first and second workers, or the marginal product, results in an increase in marginal returns. This does not mean that as the number of workers increase, the total product also increases. Until te capital is used efficiently or to its full capacity, the total product continues to increase, as well as the marginal and average product.

MP: Marginal Product, AP: Average Product, TP: Total Product, QL:Number fo workers


1b.) Define the law of diminishing returns and assess the likelihood that it will be experienced by a firm producing a product in a consumer good market.

The law of diminishing returns is defined that as additional units of a variable resource (in this case, labor) are added to fixed resources (land and capital), beyond a certain point the marginal product of the variable resource will decline. This law is likely for a firm that wishes to increase its productivity in a short run. The first thing that the firm can think of is to hire more workers as the shop’s popularity increases. However, if the number of workers exceed the capacity of a fixed number of capital or land, the quantity produced will decrease. The last employee has nothing to do and he would just be a disturbance to the other workers, decreasing the productivity.


As the MP increase, the slope of the TP gets steeper. However when the shop is experiencing diminishing marginal returns as the productivity of labor decline, the slope of TP becomes moderate. When MP is at the negative point, the TP also begins to decline since the additional workers are not useful at all. To avoid this scenario, firms can increase the working hours with a fewer number of workers to create a constant increase in production. As for growing in the long run, the firms can increase the number of capital and labor.

Ch.6 Market Failure

2a.) What are positive externalities and how do they arise? Illustrate your answer with examples.

Positive externalities are when the third parties benefit from the production/consumption of goods and services. Compared to negative externalities, which is when the third parties bear spillover costs of the production/consumption of goods and services, positive externalities may seem very rare, however it can be applied in many situations. Companies or groups producing one good benefits others beyond itself and the customer.


As you can see from the graph above the blue triangle indicates a potential welfare gain, or when the marginal social cost (NSC) is lower than the marginal private cost (MPC). In P1, the MSC has much lower cost than MPC, declaring that more production is available. The blue triangle indicates the extra benefits of production in MSC. Positive externalities arise as the gaps between MPC and MSC gets larger.

Positive externalities arise by the consumption of some good creating benefits to the third parties. Additional years of education, for instance, can create a strong spillover benefits for the rest of the society. This may answer the question for those who ask, “If I don’t have children, why do I have to pay for schools?” Simple answers such as “the more children attaining school, the less criminal rate,” is efficient however does not give any benefit to the people paying. If (lets say the person who asked this question Mr.A) Mr.A continues paying for school now, more children gets to go to school and have proper education. In addition, by the time Mr.A retires his job the children he payed for would be in the working age, and they will be paying Mr.A’s pensions. In other words, the benefits for the children now would come back and become a positive externality for himself later on. In comparison, if Mr.A doesn’t pay taxes for school, less children would be going to school, which increase the unemployment rate and children starts joining gangs. Therefore, if Mr.A pay more for school, his own positive externality arises in the future.

2b.) To what extent should governments attempt to influence markets where positive externalities exist?

Government has the power to encourage extra production by simply pushing the MPC outwards towards the production of MPC=MPB, and output is at its optimal point. They do this by the payment of subsidies. However, the subsidies are payed from tax revenues from the government budget, thus opportunity cost for other usage must be concerned. As the point MPC is pushed from Q1 to Q, consumers can afford more products in a cheaper price.

Economics in Pictures Kansai Super Market


Observation at the Kansai Supermarket:

Aisles


As you can see, the aisles in this supermarket is in between two rows of products. Each row of products are not lined straight, but slightly in a narrowing shape towards the inner part of the store. The angle leads the consumers’ sight to focus on the meat section, which is in the inner part, as well as showing all the snacks at once. As the consumers come into the store, they can search for what they want in a glimpse.

Also in this milk and yogurt section, the items are lined up so that the consumers can easily look through all the rows, by shifting the lowest row front.


In the meat section, they set a mirror on the top so that it looks as if the consumers has many alternatives available to choose from. Also, the price sign is in yellow and gives an impact, which may be an incentive for him/her to buy that item.


Down the aisle of the meat section, there are rows of products on sale. The store planned to set these sales products in the farther side from the entrance so that the costumers will see other goods as they come to this row.


Goods such as envelopes, gums and cough drops are set right next to the register of the store. Normally, these type of goods are often not in the costumers’ interests, therefore by setting them next to the register, it gives incentives for consumers to buy it because they already have their money out.


Ch.5 Government Intervention

35.) Select a product and create a market supply and demand diagram

  1. Show the equilibrium price and quantity, and set a binding price ceiling.

Calculate the change in consumer expenditure/producer revenue

The graph above shows the effects of maximum price set for oranges at $1 per oranges. The equilibrium price is $6.00, at which price 2500 kilos of oranges are sold. The price ceiling reduces the price to $3.5, which increases the quantity demanded to 3500 kilos. But at the same time it reduces the quantity supplied to 1500 kilos. Thus at the price-ceiling price, there is excess demand of 2000 kilos.

Consumer expenditure and producer revenue (the same amount in this case) before the price ceiling was $6X2500=$15000. With the price ceiling, consumer expenditure/producer revenue will be $3.5X1500=$5250. Thus, consumer expenditure/producer revenue has fallen by $9750. There is also considerably less oranges sold on the market.

Identify and calculate the government subsidy expenditure needed to eliminate the shortage.

One method to eliminate the shortage is by the government paying subsidies to producers. This subsidy must shift supply far enough to the right to meet the quantity demanded at $3.50, which is 3500 kilos. Therefore it must fill the gap of 2000 kilos.

We can find the per-unit amount necessary to fill the gap by calculating the distance between the old supply curve S, and the new supply curve S (SUB) at 3500 units. In this case, the per-unit amount would be $8.5-$3.5=$5 per unit. The total amount of the subsidy is calculated by multiplying the per-unit amount by the number of units to be subsidized: $5X3500=$17500.

If this method cost too much, the government could directly provide the good. In this case, the government would have to establish its own orange-growing farms. In either case, there would be a significant opportunity cost of allocating government resources.

36.) Select a product and create a market supply and demand diagram. 

1. Show the equilibrium price and quantity, and set a binding price floor.

2. Calculate the change in consumer expenditure/producer revenue.

The price floor affected the minimum price for milk set at $9 per litre. The equilibrium price is normally $6, at which price 3000 litres of milk are sold. The price floor raises the price to $9, which increases the quantity supplied to 4500 litres. But at the same time it reduces the quantity demanded to 2500 litres. At the price-floor price, there is an excess supply of 2000 litres.
3. Identify and calculate the government expenditure needed to eliminate the surplus.

Producer revenue/consumer expenditure before the price floor was $6X3000=$18000. Now it is $9X2500=$22500. Milk producer revenue has increased by $4500. The excess supply can be managed in several methods:

  1. The government could throw out the excess milk. However this method may be politically and ethically displease, and producers might continue losing revenue.
  2. The government might dump the excess milk to foreign countries. However this is not meant for milk that can be spoiled very quickly, but for storable products such as corn or rice. In addition, the price can get low, but at the same time this method may harm the trading relations.
  3. The government might buy up the surplus. In this case, the government must pay $9 price floor price. Also they need to buy the amount difference between the new quantity demanded (2500 litres) and supplied (4500 litres) after the price floor was set. Therefore the cost would be $9X2000=18000.

Thus in a situation of price floor, it is also necessary for the government to have a significant opportunity cost for providing other services such as health care and education.

44.) What is the effect of price controls on allocative efficiency?

When a price ceiling is set, it eliminates the allocative efficiency, which is the marginal benefit equaled to marginal cost. The government sets the market price of (in this case) oranges, causing the society not able to produce sufficient amount of oranges to meet the price. Thus a price ceiling cause shortage. In comparison, the price floor causes allocative inefficiency. The high price encourage the producer to produce products at an amount where marginal cost exceeds marginal benefit, beyond the equilibrium. This cause over production or surplus.

46.)Evaluate the effectiveness of rent control.

Rent control is an effect caused by price ceiling, to lower the prise of houses, affordable for low-income citizens. This sounds as a great method, however it causes shortage. By looking at the rules of supply and demand, as the price decline, quantity supplied also decreases. In this case, the reduction of price would lessen the number of house sold. However since the price is cheaper, the demand rises, causing shortage and a shrink in the market. This also causes the quality of the house to fall, because the price is cheap, the total revenue decreases and owners cannot afford to upgrade it. Renters choose to save money rather than spending on improving the house’s safety, weakening the house and unprepared for hazards and disasters. The people who couldn’t buy the house will have less choices because of the price ceiling. Rent control is ineffective because some people chooses to buy houses illegally. For example, in order to definitely get that house, people pay extra money to the renter. In addition, the renter may secretly raise the price so their profit would increase. Illegal action would result in unmanageable rent control for the government. Rent control is a great idea theoretically, however the side effects may affect the borrowers’ lives.

3a.) Explain the concepts of maximum and minimum price controls. 

Maximum price control, or price ceiling is a government intervention used when they determine that there is great potential for high prices and makes a goal of keeping prices low. Governments use this procedure to make the good affordable for indigent citizens. However this decreases the market size, because the demand exceeds supply.

Minimum price control, or price floor is when governments raise the price of a good because it is believed to be important or necessary, or it may be supporting employment in a particular industry. Again, this reduces market size because the quantity supplied exceeds quantity demanded and cause a surplus.

3b.) Evaluate the idea that government intervention in the form of price ceilings and price floors is well intentioned, but often leads to undesirable side effects. 

Theoretically, the idea to decrease the market price and make the good affordable for poorer inhabitants in price ceiling sounds as well intentioned. Again, the side effects are shortages since the quantity demanded exceeds quantity supplied. Thus individuals illegally purchase that good by paying extra money and creating a black market. This side effect conceals the reality that the government cannot underestimate the shortage and provide a solution. In addition in price floors, it sounds as well intentioned to raise the minimum price of a valuable good and retain it. However price floor causes surplus and a reduction on market size, creating informal markets, where firms choose to sell their surplus at prices below equilibrium. Informal markets contradicts to the ideal aim of keeping valuable goods. Both methods has a solution that the government pays all the shortage and surplus or provide the good to residents. Depending on the good, this decision is politically and ethically outrageous and the solution always have opportunity costs of the government spending money on health and education. As a result the government intervention in the form of price ceilings and price floors is  ideally well intentioned, but often leads to undesirable side effects, and an opportunity cost to the government itself to fix it.

Chapter 4: Elasticities

1a.) With the use of examples, explain why some products have a low price elasticity while others have a high elasticity.

First of all, we need to know what the price elasticity is. Elasticity measures how much one factor changes in response to a change in a different factor. An increase in price of an elastic good would decrease demand because consumers doesn’t need the good, there are no reasons to buy it. For example, we can live without tea and shampoo, or we can make it by ourselves in a lower price, therefore as the price of tea and shampoo rise, the demand falls. In comparison, an Inelastic good is a good that consumers need, and even if the price rises you still buy it. For example, we need oil to produce energy and we cannot create it by ourselves therefore even if the oil price rise, the demand doesn’t show a large change. Price Elasticity of Demand (PED) is a measure of the responsiveness or sensitivity of consumers to a change in the price of a particular product. In other words, when the price rises the consumers would lose attractiveness to that product leading to a decline in quantity demanded. On the other hand, when the price decrease, the consumers find more attractiveness to that good thus the quantity demanded increase. We can determine the PED by dividing the percent change in quantity demanded by the percent change in price

For example, when the Apple MacBook Pro was sold as $900 in September, the quantity demanded was 70,000 in the United States. In December, the price is marked down to $700 and sold 73,000 MacBook Pros. Assuming no other variables changed between September and November, how responsive are the consumers in the US to the change in price of this MacBook Pro? To determine the PED for the product, we can apply the price and quantity information to the equation below.

The PED for these MacBook Pro between $900 and $700 in the US is -0.19. A fall in price of 22% led to an increase in quantity demanded of 4.2%. Since the law of demand applies to most of the goods and services, we typically ignore the negative sign and express PED as an absolute value. Thus, the PED for the MacBook Pro in the above example between the prices quoted is 0.19.

Now, we call the products differently depending on the PED resulted.

When the PED is greater than 0 but less than 1, the situation is called inelastic demand. The percent change in quantity was less than the percentage change in price, like the example above, shows that the consumers are rather insensitive to changes in price. Inelastic demand is an example of a high price elasticity. High price elasticity occurs when there is a small change in price and a large change in quantity demanded. For instance, a small change in oil price would cause a increase in quantity demanded. Consumers are more sensitive to price change when the price of the good is higher.

When the PED is greater than 1, the situation is called elastic demand. For example, when the price of tea falls by 10%, the quantity demanded increases by 30%. The PED is 30/10 = 3. A coefficient greater than one indicates that the percentage change in quantity demanded goes beyond the percentage change in price. In this case the consumers are responsive or sensitive to price changes, therefore it is an elastic demand. Elastic demand could be the senario for a low price elasticity. Low price elasticity occurs when there is a large change in price, but a small change in quantity demanded. The lower the price of a good, consumers are insensitive to price changes.

1b.) If you were employed as an economist by a business, discuss why a knowledge of the price elasticity of demand of your product would be useful. 

If I was employed as an economist by a business, a knowledge of the price elasticity of demand of my product would be useful, because I can inform businesses that produce a good to decide the output and price at the most favorable level. For example, when a firm or industry plans to decrease the output of their product, they also need to consider the effect on their total revenue from increase in price.

Ch.3 Market Equilibrium and Efficiency

1. Identify three reasons why the supply of oranges, for example, might increase and explain how this change will result in a new equilibrium.

a. Fertilizer

When the fertilizer improves its production, farmers would be able to successfully produce more oranges at the same time as last year. Therefore an improvement in fertilizer would increase orange supply.

b. Weather

Oranges are harvested during the winter. If the weather constantly maintains the ideal temperature (35º to 50º F (1.67º-10º C) this year, farmers can harvest more quantities of oranges compared to the previous years. Therefore a good weather can also increase orange supply.

c. Prices of related good


For example, if the price of apples rises, the consumers tastes and preferences would change into oranges. Apples and oranges are inferior goods and substitute goods. Therefore as the price of apple rise, the demand of oranges rise. If demand rises, farmers would have to grow more oranges, which increases supply.

The three scenarios would all increase supply, which also changes the result of the new equilibrium. An increase in supply would display a shift in the right on the Supply graph. The supply would shift to the right, however the demand doesn’t change yet. Therefore this causes a short term surplus. When the supply increases, the price decrease. Thus consumers would buy more oranges, which would move the equilibrium price lower. As a result, the equilibrium price decreases the price as it increases the quantity.

References

http://www.hort.purdue.edu/newcrop/morton/orange.html#Climate


4. Using a diagram, explain the concept of community surplus

Community surplus is about the consumer surplus and producer surplus.


Consumer surplus is the benefit consumers receive when they pay a price below what they are willing to pay. This is calculated by subtracting the actual market price from the price that the consumers are willing to pay. For example, if a DVD has an equilibrium price of $15, the consumers willing to pay $25 will have a consumer surplus of $10.


On the other hand, Producer surplus is the benefit producers receive when they receive a price above the one at which they were willing to supply the good. For example, when the actual price of a DVD is $5 but the market price is $15, the producer surplus would be $10. The market price stays the same when the actual price is $15 (producer surplus=0), because the quantity supplied is higher when its $15.


The community surplus is shown on the graph below:

IB 1 Econ System Report

Capitalism: Singapore

http://www.bbc.co.uk/news/uk-scotland-scotland-business-19466459

Singapore is a capitalist country. Most of the companies in Singapore are private limited liability companies, however we cannot call it a totally free market, because there are Temasek-linked companies (TLC); companies linked to the government’s investment arm. TLCs are the incentives for the 60% of current GDP. The IOM (Institute of Occupation Medicine) are also private company from Britain. They chose to provide research and consulting services on Singapore with government involved. In order to start a newIndividuals, in this case the IOMs chose all three economic questions and price would choose of for whom to provide health care. Therefore Singapore is a country which is extremely close to market economy.

Mixed Economy (Command-leaning): Japan

http://www.bbc.com/news/technology-19508795

Japan is an example of a Mixed Economy which is market leaning. The market forces and the government determine resource allocation. However in this case Japan is leaning more towards the government. In the article above, the Japanese Rakuten has invented Kobo, an electric tablet used only for reading. In this case, the Japanese Rakuten is the individual who decided how to produce and the price decides for whom to produce. The government determine the quantity supplied and consumers determine what is produced with government support. Since the government is involved for the Kobo production, the government would get influenced depending on the reputation of Kobo. This innovation would cause competition since Kobo is a heterogeneous product. In a OECD like Japan, many companies has the technology to produce a similar good as Kobo. In the near future Kobo would become a Homogeneous good, in high competition. Therefore the Japanese economic growth controlled by the government would dramatically change too.

Socialism: Cuba

http://www.bloomberg.com/news/2011-08-09/engagement-with-cuba-is-way-to-undermine-communist-rule-view.html

Cuba is one of the few remaining communist economy. Fidel Castro’s dictatorship has performed a rapid growth and supported the revolution in Latin America in 1991. He has also admitted that socialism would no longer work. As a result, currently Raul Castro has started to “reform” the country’s economic system. For example, he allowed Cubans to purchase DVD players, computers and mobile phones. In the end of 2011, he had allowed Cuban citizens to buy and sell lands subject to as-yet-unspecified restrictions. The government would also eliminate more than 1 million state jobs to force workers so that they can find employment and it will loosen state controls on agriculture and small business. Again, Raul has “reformed” the communist economic system, but he will not “replace” it. The United States has attempted to undermine the communism in Cuba by loosening the ban on travel to Cuba. This will increase tourism revenue, as well as a success to undermining Castro’s mind of monopoly.

References:


Chapter 2: Competitive Markets: Demand and Supply

p. 52 Practice Question

1. Explain the difference between a movement along the demand curve and a shift in the demand curve.

A movement along the demand curve occurs when there is a change in price. For example, a change in the market price of a candy from $1.00 to $2.00 causes a movement along the demand curve and a decrease in the quantity demanded. In comparison, a shift in the demand curve occurs when the non-price determinants of demand changes. If demand were to increase, a shift of the demand curve outwards or to the right would occur, because as the demand increase, the quantity demanded also increases, which shifts the whole demand curve outwards. In other words, when either price or quantity demanded change, there is a movement along the demand curve, and when both were to increase/decrease a shift in demand occurs.

Chapter 1: The Foundation of Economics

p. 20 Practice Question

2a. The choice between military products and the provision of healthcare illustrates the problem of ‘opportunity cost’. Explain the nature of this problem, using a production possibility curve to help you.

First of all, opportunity is the opportunity lost when making a decision of how to use our scarce resources, whether it’s time, money, labour, land or capital. If a country chooses to produce more military products, its opportunity cost is the provision of healthcare. If the country decided to focus on the provision of health care, it shows an opposite result. I will explain this by using guns as a military product and butter as food, which is a type of  healthcare.

For example, if the country decides to produce 180 Guns and 100 lbs of Butter because it had a weak military, its choice maximizes our utility from a need of a strong military. However the opportunity cost for producing more guns are the benefits it could have gained from producing butter instead such as time, land, labour and capital. The opportunity cost on time was the time we could have spent on producing butter we used it on building military goods instead. Also, the field that could have been used to breed cows will be gone as well as the farmers and butter creators. In addition, the decrease in butter supply would lead to a decline to the provision of health care because citizens would not be able to cook a meal without enough butter provided. Without food, they will die.

On the other hand, if the country chooses to produce 900 lbs of Butters and 20 guns because of poverty, the citizens’ health care will rise up, however the opportunity cost is the time the country could have spent on building a stronger military. The opportunity cost in capital is the steel that could have been used to create guns. The country lose time to create enough guns to use in a sudden battle.

2b.) To what extent does the production possibilities curve model accurately represent the scarcity faced by less developed countries in the world today?

The production possibilities curve can represent scarcity when the point is outside the curve. Also, it can show the total amount of scarcity that both military products and healthcare is facing. However, that is the extent that PPC can do, therefore we cannot tell which product is scarce, and the specific amount of scarcity in guns and butter. As a result, the government can identify that there is scarcity going on by looking at the PPC curve, however they cannot decide how to solve scarcity.